情
- 最大赞力
- 0.00
- 当前赞力
- 0.00%
Friday's Inventory: 09-15-06
Here is the first installment of VHB Friday Inventory. We discuss some of the data issues and sources here. In this post, I'll just stick to describing the results.
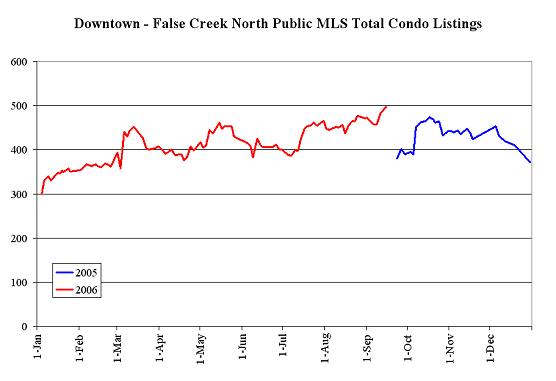
First up, let's look at total active condo listings in Downtown-False Creek North.
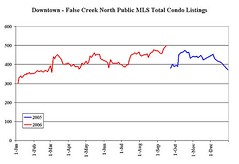
We are just a squeak below 500, at 497. This is the highest since I started recording. Unless there is a big drop off, it looks like the year-over-year comparisons will start showing a 10 percent-ish increase when we start getting year-over-year overlaps next week. 10 percent is not a huge increase.
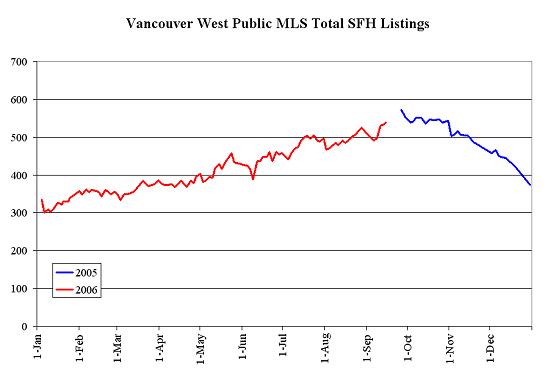
Next, let's look at SFH inventory for Vancouver West.
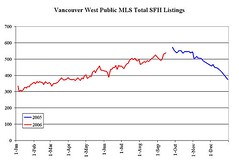
Inventory is up close to its highs from last September and October. The slow seasonal pattern is very evident here, with a big drop off from around 550 to around 300 from October to January. Will it drop off the same way this Fall?
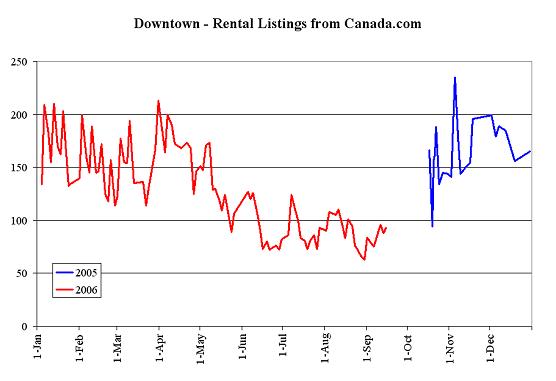
Finally, let's look at rentals listed at canada.com for downtown apartments.
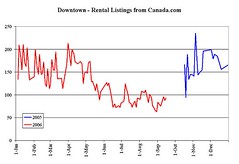
There was a very big drop starting in June and persisting to now. Is this a regular seasonal slowdown in the apartment rental market, or is this the 'tightness' in the rental market that we've been hearing about? We'll have more answers in a few weeks when we start getting year-over-year comparisons. It will also be interesting to see what happens to these numbers when Yaletown Park etc. go on the market over the next few months.
Here is the underlying data. This will be a regular Friday feature from now on.
Labels: Friday inventory, statistics
posted by Van Housing Blogger at 10:22 AM 35 comments
Friday Inventory Data
Last September, I started recording some inventory stats a few times a week. I got them from two sources: mls.ca for the for sale stuff and canada.com for the rental stuff.
I am now very close to having a complete year of data for most of the series, so it's time to start posting them. I think I'll post these regularly every Friday.
I have three graphs to show: Van West SFH listings, Downtown+False Creek North Condos, and downtown rental apartment listings. I'll get to the graphs in the next post. In this post I will discuss a few data issues.
The numbers I chose to record are somewhat arbitrary. But that's what we have to work with, so let's think about how I put the numbers together:
Some comments on using mls.ca:
The biggest problem with this source is that it only captures the listings that go through this one particular venue. I think it's the number one place to go for listings in Vancouver, but it will not capture everything. For example, it will miss out on stuff posted exclusively on Craigslist.
Again, the year-over-year makes this very useful since we can at least see the trends. However, the year-over-year will be misleading if there has been a noticeable shift away from people listing apartments through the Sun/Province/Canada.com and places like Craigslist.
Some comments on Van West SFH:
The Vancouver West Single Family House (VW-SFH) series comes from searching MLS.ca for single family houses for sale in the entire Vancouver West region. Pretty simple. Since listings are now over 500, I split the search into over and under $1million.
Some comments on Downtown False Creek North Condos:
This is a search from mls.ca selecting only the False Creek North and the Downtown parts of Vancouver West. I search for condominium listings of any type.
Until the Spring, I was just doing a search of the 'downtown' zone. However, one day in the Spring I noticed a big drop in DT and at the same time the appearance of a new-to-me zone called 'False Creek North'. I combined the search and got something close to the count I had for just DT a few days earlier. This led me to conclude that the DT zone had been split into DT and FN. So, to have a consistent series, I use the DT series until the change and then a combined DT-FN series.
I checked a few days ago with Agent Will. He told me that in the Realtors-only MLS the FN zone has always been there. However, he did confirm that in the public-use MLS the FN zone was just introduced earlier this year. I take this as confirmation that I got this right. If anyone has better information on this, I'd be happy to be corrected.
I should note that I also separately record the Coal Harbour condos listings, but I'm not going to regularly post them since it's a pretty small area.
Some comments on Downtown Rentals:
For this data, I search all parts of downtown, clicking the 'suites and apartments' box only.
Closing comments
When I started this, I chose a few regions to record. I have no idea why I didn't include the west end with my downtown search. I think I was looking for the hot speculator action more than the older building stock in the west end. But, that's water under the bridge because I'm not changing now.
Also, I maybe should have started recording Craigslist rentals and many other things a year ago - but I didn't. I'm also held back by the fact that I like my search to be very quick - I don't have time to do dozens of searches on a regular basis.
So, I have what I have. The important thing is to interpret it correctly.
Overall, I'd appreciate any feedback about this.
Labels: Friday inventory, statistics
posted by Van Housing Blogger at 10:18 AM 1 comments
Thursday, September 14, 2006
New feature

Hi. Be sure to come back and visit on Friday morning to see a new feature here at VHB. It has been a year in the making, and it should really help us figure out where things are going. What will it be? Only VHB knows . . .
posted by Van Housing Blogger at 5:08 PM
Cycles update
 With all the talk in the last post about CMHC's Cameron Muir invoking the 'cycles' word, it seems like a good time to update my cycles chart. Last year, I did a post that analyzed cycles in Vancouver real estate. The point was:
So, I have made a new cycles table that uses the UBC numbers instead of Royal Lepage's. Actually, the UBC guys also use Royal-Lepage, but they combine the numbers for different parts of town and housing types to form an aggregate for Vancouver. I couldn't find the documentation for how exactly they did it, but I trust them enough to go with it.
The downside of the UBC data is that they haven't updated it in real time. So, we only get data up to 2005Q3.
So, here is the Vancouver cycles chart using the UBC data:
Date Date QuartersTrough Quarters Peak time
of ofuntilto peakuntil to troughtoCycle troughpeakpeakgaintroughlossrecovery11975Q21976Q2412.1%1114.8%1521979Q11981Q18118.8%1951.0%9831985Q31990Q21969.2%78.5%5841992Q11994Q41126.9%2723.6%425*2001Q32005Q31637.8%------
cycle 1-4 average
10.556.8%16.024.5%53.3
Important notes:
Date Date QuartersTrough Quarters Peak time
of ofuntilto peakuntil to troughtoCycle troughpeakpeakgaintroughlossrecovery1--1976Q2----1017.2%1521978Q41981Q19101.1%745.2%2631982Q41989Q226113.5%830.0%5841991Q21995Q31739.9%2820.6%335*2002Q32006Q21567.1%------
cycle 1-4 average
17.384.8%13.328.3%33.0
posted by Van Housing Blogger at 8:53 AM 56 comments
Wednesday, September 13, 2006
Affordability in the Sun
Article in the Sun today quoting some affordability numbers from CMHC. They calculate the average mortgage costs $2322 a month, assuming a 25% downpayment on a 25 year mortgage at the 5-yr posted rate when buying the average Vancouver house. Few put down 25% anymore, but the posted rate is obviously an overestimate of what people actually pay. That said, at least it is a consistent measure through time to gauge affordability.
Cam Muir is quoted:
Peter Norman from Clayton Research follows up with an 'it'll all be alright' quote:
posted by Van Housing Blogger at 8:13 AM 84 comments
Tuesday, September 12, 2006
Bob Says . . . .

By email I got a link to this article in Business in Vancouver from a couple of weeks ago. It is by subscription only, I'm afraid. I'll quote a few interesting excerpts from it, but if you want the whole thing go to your local library and dig it up!
The article is a pretty balanced description of the current state of the condo market. For the 'watch out' side, they have PWC's Craig Hennigar. For the 'no problems' side of the argument, they interviewed Vancouver's condo king, Bob Rennie.
First, we have another confirmation about the extent of investor activity in downtown condos. Rennie has said 50% in the past; here it is quoted as a little lower:
First: he guarantees everything will be ok.
Second: he tells us that we are running out of condos.
Third: if you don't buy now you'll be priced out forever.
His audacity is stunning. I am very glad we have these quotes preserved. Some bubble blogger in 2021 is going to enjoy them . . . .
posted by Van Housing Blogger at 9:49 PM 27 comments
Congressional Hearings
 I'm actually shocked this is happening so quickly: the politicians are getting involved in the bubble in the US. Tomorrow there are Senate hearings on the housing bubble and the implications for the economy. Next week they are doing some hearings on 'creative financing'.
The blame game begins. (Hat tip to Calculated Risk.)
posted by Van Housing Blogger at 9:24 PM 10 comments
Monday, September 11, 2006
Ask VHB, #5
 It's Monday, so let's start the week off right with another round of 'Ask VHB.'
Here is the setup:
Sounds like a pretty nice position to be in right now. They have cash and are not in a rush.
Well, what do you think? Is 'timing the market' the right way to go?
BTW, I'm pretty much through my backlog of 'ask VHB' questions. If you want to be featured next week, send an email with your situation.
[comments closed]
posted by Van Housing Blogger at 6:42 AM 95 comments
Housing starts down
The CMHC preliminary housing start data is out. (Full pdf here.) We get the finalreport with completions, starts, in-construction etc. at the end of the month.
Starts for Urban BC are down. The series, however, is very volatile, so we shouldn't make too much out of one month's number. Especially the 'seasonally adjusted at annual rates' number that gets quoted in the press. It whipsaws back and forth every month. I prefer working with the raw number and doing y-o-y comparisons to deal with the regular monthly variation.
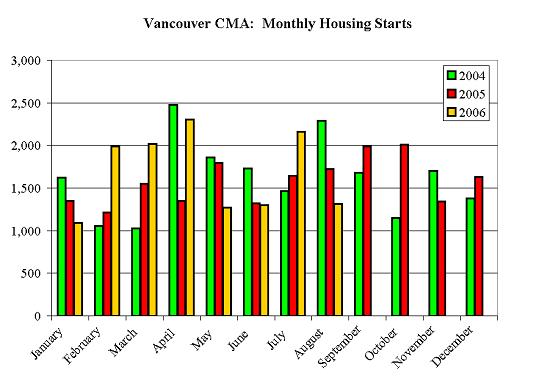
Here is a chart for Vancouver CMA.
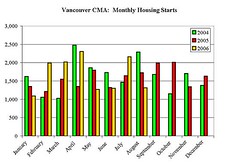
You can see a huge drop in August vs. July; and August 06 vs previous Augusts. However, if you take the July and August added together, we're still ahead of last year. The year-to-date number is up 13%. Also, in the pdf you can see that SFH starts are up compared to August last year - it is the multiple starts that are down. Because multiple starts are more lumpy, we expect that series to be more volatile.
All that said, down is down. We'll see next month if this was a trend or a blip.
posted by Van Housing Blogger at 6:39 AM 31 comments
Sunday, September 10, 2006
How's that Australian soft landing going?
 Answer: not too well. Record foreclosures. Prices down in some places by 25%.
posted by Van Housing Blogger at 2:05 PM 51 comments
Friday, September 08, 2006
Krugman says 'bubblicious'
One of David's (from bubblemeter) favourite words is bubblicious. Watch Paul Krugman on this video say 'bubblicious' and a whole lot more. Hat tip to calculatedrisk.
Unrelated - check out this picture (from housingpanic). Marinite dates the picture from 1875. No really - it's different this time - we're Vancouver!

[comments closed]
posted by Van Housing Blogger at 10:28 AM 54 comments
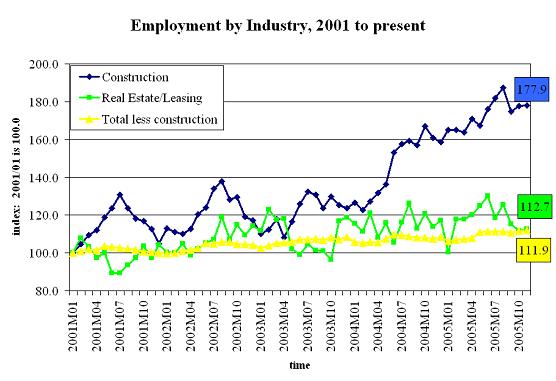
How important are construction jobs?
Today the Sun has a big story about a special effects company locating in Vancouver. Yesterday we learned about the shoe empire in Burnaby. Are these the things driving BC's boom?
In a word: no.
It's construction.
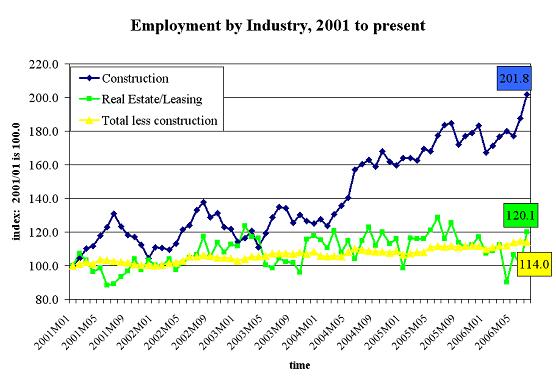
Time to update our labour market industry breakdown. The charts below include data up to July, 2006. We did this once before, 8 months ago. Let's see if things have changed.

Employment in BC taking out construction and real estate/leasing jobs is up only 14% from January 2001 to now. The total population of BC age 15+ is up 8.7% over that same period, and the labour force is up 15.0%. So, the growth in non-construction jobs hasn't even kept up with the growth in the labour force.
On the other hand, construction employment has more than doubled and real estate/leasing employment is up about 20%.
How important are these to the overall unemployment rate? Answer: Very important.
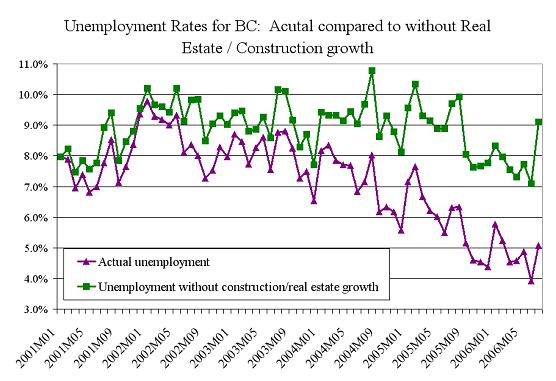
Let's calculate the proportion of people age 15+ who are employed in construction. In January 2001, it was 3.0%. Let's say that, as a proportion of population, we keep this constant as we go forward to July 2006. This is effectively assuming that we don't need any more construction workers per BCer than we needed in January 2001. What happens now to the unemployment rate?
In this chart, I performed the above exercise assuming both construction and real estate/leasing employment to population ratios stay constant at their January 2001 levels. The purple line graphs out the actual unemployment rate. (Attentive readers might note a difference between the overall unemployment rate here and in the other unemployment chart. The difference, I think, is that the by-industry breakdowns are not seasonally adjusted. Not a big difference, though.)
The green line shows the rate under the constant real estate/construction employment assumption.
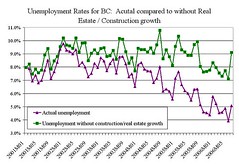
If there had been no construction boom, the green line shows us that the labour market boom would have pretty much been non-existent. The average gap between the purple line and the green line for the 12 months ended July 2006 is 3.1%. In other words, if construction employment as a share of population were to revert to its 2001 level, the unemployment rate in BC would jump by 3.1%, leaving 100K more people unemployed.
[clarifying update: the assumption I make in the above analysis is that the people not employed in construction remain in the labour force; seeking work. The alternative graph would have been to look at employment rates, which are calculated as a percent of population rather than the labour force. If you download the spreadsheet (see below) you can see the employment rates show a similar picture to the UE graph above.]
What's the point of this? I mean, construction is a part of the economy, so what do we learn by taking it out? Who cares so long as people are employed?
The reason this is informative is that it shows the sensitivity of our boom to construction employment. For the labour market, the boom is entirely about construction.
So, if something were to hit construction - a housing market downturn, for example - the great BC employment boom would be over. Those who argue that housing cannot go bust because employment is strong have the causality reversed - employment is strong because of the housing boom.
A final note. Some readers have pointed out the super huge number of infrastructure projects that are scheduled to be constructed over the next few years - 100 billion by some counts. The BC government produces a 'major projects inventory' publication (big pdf here - thanks to 'scoop' for the scoop). On page 19, they have a table for the lower mainland:
For 2001, non-residential $value of construction permits was $1.384 billion. Residential was $2.013 billion.
For 2005, non-residential is $1.975 and residential is $4.41 billion.
So, if residential were to, say, fall by half, then non-residential would have to double again from 2005's already high number to make up the difference. So, all of those Olympic projects, bridges, and skytrains are nice mitigating factors, but they don't have enough firepower to fully compensate for any sizeable residential slowdown.
The spreadsheet with the raw numbers is available here.
posted by Van Housing Blogger at 9:04 AM 58 comments
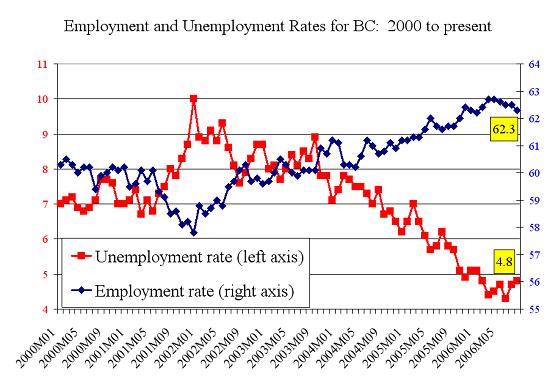
Labour market steady at the top
The lastest jobs data release is out. BC's unemployment rate ticked up a tiny bit and the employment rate ticked down. No big moves. Given that the source for this data is a survey, there is going to be some noise in the month-to-month numbers. So, it wouldn't be useful to over-interpret little ticks up or down.
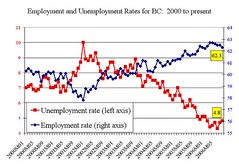
That said, looking over the last 6 months it looks like we may be past the recent peak of labour market frenzy. But compared to the long-term trends, the labour market is still in phenomenal, unprecedentedly good shape.
posted by Van Housing Blogger at 8:32 AM 3 comments
Here is the first installment of VHB Friday Inventory. We discuss some of the data issues and sources here. In this post, I'll just stick to describing the results.
First up, let's look at total active condo listings in Downtown-False Creek North.
We are just a squeak below 500, at 497. This is the highest since I started recording. Unless there is a big drop off, it looks like the year-over-year comparisons will start showing a 10 percent-ish increase when we start getting year-over-year overlaps next week. 10 percent is not a huge increase.
Next, let's look at SFH inventory for Vancouver West.
Inventory is up close to its highs from last September and October. The slow seasonal pattern is very evident here, with a big drop off from around 550 to around 300 from October to January. Will it drop off the same way this Fall?
Finally, let's look at rentals listed at canada.com for downtown apartments.
There was a very big drop starting in June and persisting to now. Is this a regular seasonal slowdown in the apartment rental market, or is this the 'tightness' in the rental market that we've been hearing about? We'll have more answers in a few weeks when we start getting year-over-year comparisons. It will also be interesting to see what happens to these numbers when Yaletown Park etc. go on the market over the next few months.
Here is the underlying data. This will be a regular Friday feature from now on.
Labels: Friday inventory, statistics
posted by Van Housing Blogger at 10:22 AM 35 comments
Friday Inventory Data
Last September, I started recording some inventory stats a few times a week. I got them from two sources: mls.ca for the for sale stuff and canada.com for the rental stuff.
I am now very close to having a complete year of data for most of the series, so it's time to start posting them. I think I'll post these regularly every Friday.
I have three graphs to show: Van West SFH listings, Downtown+False Creek North Condos, and downtown rental apartment listings. I'll get to the graphs in the next post. In this post I will discuss a few data issues.
The numbers I chose to record are somewhat arbitrary. But that's what we have to work with, so let's think about how I put the numbers together:
Some comments on using mls.ca:
- I have learned through reading here and at Real Estate Talks that the public version of the mls has a number of flaws. Listings that have already been sold sometimes stay listed on the public MLS too long and new listings are sometimes slow to appear.
- For these reasons, we shouldn't take these numbers as definitive.
- Given this flaw, what can we learn? I still think these numbers are useful for picking up trends. This makes the year-over-year comparisons especially important, since we will really be able to see the trends much better.
- Year-over-year trends could be misleading, however, if there has been a change in the proportion of houses for sale that do not go through MLS. People using internet services, or FSBO, for example. I don't know how big a deal this is.
- mls.ca restricts the number of results to 500. This makes it very hard to do big aggregations like the entire GVRD. As time goes on, it might get harder to do small areas, too, if inventory were to explode
")
The biggest problem with this source is that it only captures the listings that go through this one particular venue. I think it's the number one place to go for listings in Vancouver, but it will not capture everything. For example, it will miss out on stuff posted exclusively on Craigslist.
Again, the year-over-year makes this very useful since we can at least see the trends. However, the year-over-year will be misleading if there has been a noticeable shift away from people listing apartments through the Sun/Province/Canada.com and places like Craigslist.
Some comments on Van West SFH:
The Vancouver West Single Family House (VW-SFH) series comes from searching MLS.ca for single family houses for sale in the entire Vancouver West region. Pretty simple. Since listings are now over 500, I split the search into over and under $1million.
Some comments on Downtown False Creek North Condos:
This is a search from mls.ca selecting only the False Creek North and the Downtown parts of Vancouver West. I search for condominium listings of any type.
Until the Spring, I was just doing a search of the 'downtown' zone. However, one day in the Spring I noticed a big drop in DT and at the same time the appearance of a new-to-me zone called 'False Creek North'. I combined the search and got something close to the count I had for just DT a few days earlier. This led me to conclude that the DT zone had been split into DT and FN. So, to have a consistent series, I use the DT series until the change and then a combined DT-FN series.
I checked a few days ago with Agent Will. He told me that in the Realtors-only MLS the FN zone has always been there. However, he did confirm that in the public-use MLS the FN zone was just introduced earlier this year. I take this as confirmation that I got this right. If anyone has better information on this, I'd be happy to be corrected.
I should note that I also separately record the Coal Harbour condos listings, but I'm not going to regularly post them since it's a pretty small area.
Some comments on Downtown Rentals:
For this data, I search all parts of downtown, clicking the 'suites and apartments' box only.
Closing comments
When I started this, I chose a few regions to record. I have no idea why I didn't include the west end with my downtown search. I think I was looking for the hot speculator action more than the older building stock in the west end. But, that's water under the bridge because I'm not changing now.
Also, I maybe should have started recording Craigslist rentals and many other things a year ago - but I didn't. I'm also held back by the fact that I like my search to be very quick - I don't have time to do dozens of searches on a regular basis.
So, I have what I have. The important thing is to interpret it correctly.
Overall, I'd appreciate any feedback about this.
Labels: Friday inventory, statistics
posted by Van Housing Blogger at 10:18 AM 1 comments
Thursday, September 14, 2006
New feature

Hi. Be sure to come back and visit on Friday morning to see a new feature here at VHB. It has been a year in the making, and it should really help us figure out where things are going. What will it be? Only VHB knows . . .
posted by Van Housing Blogger at 5:08 PM
Cycles update
 With all the talk in the last post about CMHC's Cameron Muir invoking the 'cycles' word, it seems like a good time to update my cycles chart. Last year, I did a post that analyzed cycles in Vancouver real estate. The point was:
- To emphasize that there was a long-running pattern of cycles; not straight up.
- To get a sense of the 'typical' length and height of a Vancouver housing cycle.
So, I have made a new cycles table that uses the UBC numbers instead of Royal Lepage's. Actually, the UBC guys also use Royal-Lepage, but they combine the numbers for different parts of town and housing types to form an aggregate for Vancouver. I couldn't find the documentation for how exactly they did it, but I trust them enough to go with it.
The downside of the UBC data is that they haven't updated it in real time. So, we only get data up to 2005Q3.
So, here is the Vancouver cycles chart using the UBC data:
Date Date QuartersTrough Quarters Peak time
of ofuntilto peakuntil to troughtoCycle troughpeakpeakgaintroughlossrecovery11975Q21976Q2412.1%1114.8%1521979Q11981Q18118.8%1951.0%9831985Q31990Q21969.2%78.5%5841992Q11994Q41126.9%2723.6%425*2001Q32005Q31637.8%------
cycle 1-4 average
10.556.8%16.024.5%53.3
Important notes:
- everything is adjusted for inflation.
- I made some judgement calls about what is a 'cycle'. There were a few mini-bumps of a quarter or a year that I decided to subsume into a longer cycle. See the .pdf graph here, and let me know if my judgement is off.
- The averages are calculated only over the first 4 complete cycles, since cycle 5 is not yet complete. (Or is it . . . . )
- I love that 'recovery time' to the 1981 peak: 98 quarters. That's a l o n g time to wait to break even. (To break even in non-inflation adjusted terms was 33 quarters.)
Date Date QuartersTrough Quarters Peak time
of ofuntilto peakuntil to troughtoCycle troughpeakpeakgaintroughlossrecovery1--1976Q2----1017.2%1521978Q41981Q19101.1%745.2%2631982Q41989Q226113.5%830.0%5841991Q21995Q31739.9%2820.6%335*2002Q32006Q21567.1%------
cycle 1-4 average
17.384.8%13.328.3%33.0
posted by Van Housing Blogger at 8:53 AM 56 comments
Wednesday, September 13, 2006
Affordability in the Sun
Article in the Sun today quoting some affordability numbers from CMHC. They calculate the average mortgage costs $2322 a month, assuming a 25% downpayment on a 25 year mortgage at the 5-yr posted rate when buying the average Vancouver house. Few put down 25% anymore, but the posted rate is obviously an overestimate of what people actually pay. That said, at least it is a consistent measure through time to gauge affordability.
Cam Muir is quoted:
"We haven't been where we are today since 1994 and 1989 which were both peak years in their respective cycles," Cameron Muir, senior market analyst with CMHC, said in an interview.
Comparing to the turning points for two big busts? That's not good. Can Cam connect the dots:
"The affordability measures that we look at indicate that sometime going into 2007 the market will trend to more balance as more and more households who are looking to buy a home are squeezed out because of affordability issues."
Nope. So, just like last cycles, but this time we'll just go to 'balance'. Sure. The average real loss over the last four cycles in Vancouver was 28% (for Westside bungalows - the UBC numbers for a broader measure are similar, however.) It will be different this time, right? Right?
Peter Norman from Clayton Research follows up with an 'it'll all be alright' quote:
However, he expects the strong B.C. economy and infrastructure spending to continue to drive in-migration and keep prices buoyant. "We think the B.C. housing market will remain relatively solid."
Too bad the boom is mostly about construction and in-migration is essentially zero (how long will it take for these supposed 'experts' to actually CHECK the freakin' numbers!) Whoops.
posted by Van Housing Blogger at 8:13 AM 84 comments
Tuesday, September 12, 2006
Bob Says . . . .

By email I got a link to this article in Business in Vancouver from a couple of weeks ago. It is by subscription only, I'm afraid. I'll quote a few interesting excerpts from it, but if you want the whole thing go to your local library and dig it up!
The article is a pretty balanced description of the current state of the condo market. For the 'watch out' side, they have PWC's Craig Hennigar. For the 'no problems' side of the argument, they interviewed Vancouver's condo king, Bob Rennie.
First, we have another confirmation about the extent of investor activity in downtown condos. Rennie has said 50% in the past; here it is quoted as a little lower:
Statistics from marketing firm Rennie Marketing Systems indicate that investors buy upwards of 40 per cent in many projects,
The rest of the sentence is interesting as well, quoting Craig Hennigar from PWC:
. . . yet rents are well short of the amount needed to service the average mortgage. Having crunched the numbers on a few examples, Hennigar suspects that owners are counting on a long-term lift in real estate prices to pay them back “They must be, mentally, adding in a growth factor to the capital value of their asset,” he said, before sounding a more ominous note. “I think that probably a lot of that growth has been absorbed in the last couple of years. “You can’t get 20 to 30 per cent a year for a long period of time before you’re totally out of what’s reasonable for the market.”
Bob Rennie is a touch more optimistic. He offers three jaw-dropping statements.
First: he guarantees everything will be ok.
“It’s all OK,” he said, though he doesn’t expect prices to continue rising as they have been.“But with less product coming on, a stabilized rental market (and) continued low interest rates, everybody’s money is secure.”
No qualifiers. 'Everybody's money is secure.' Wow. What would happen liability-wise if a stock broker made that statement about your investment?
Second: he tells us that we are running out of condos.
The people who are buying into the market today are counting on a fundamental lack of supply in the market, Rennie believes. Woodward’s, in particular, also offered buyers a chance to participate in the appreciation in values that happens when a neighbourhood improves. “What they’re seeing is a chance to get into downtown at a great price level and with expectations of growth through the whole area,” he said. “Given today’s construction costs and no incentives to provide affordability, you’re not going to see this price point coming back.” For Rennie, the condos built and sold today will only become more desirable as downtown gets built out because there are increasingly few sites for development.
This from the guy who boasts "Clark to Commercial, Powell to First: Buy it all and we'll rezone the city." How do you square that with a perpetual shortage?Third: if you don't buy now you'll be priced out forever.
Those who haven’t bought into the market by now may be too late, he added, noting that the time is fast approaching when a downtown condo is beyond the reach of most Vancouver residents. “Vancouver,downtown, may not be affordable, and it’s a fact of life.”
For the x-teenth time - if everyone is priced out, then to whom are flippers selling? Does not compute.His audacity is stunning. I am very glad we have these quotes preserved. Some bubble blogger in 2021 is going to enjoy them . . . .
posted by Van Housing Blogger at 9:49 PM 27 comments
Congressional Hearings
 I'm actually shocked this is happening so quickly: the politicians are getting involved in the bubble in the US. Tomorrow there are Senate hearings on the housing bubble and the implications for the economy. Next week they are doing some hearings on 'creative financing'.
The blame game begins. (Hat tip to Calculated Risk.)
posted by Van Housing Blogger at 9:24 PM 10 comments
Monday, September 11, 2006
Ask VHB, #5
 It's Monday, so let's start the week off right with another round of 'Ask VHB.'
Here is the setup:
- Try to be constructive on the advice given.
- I will not post names or emails obviously. In addition, some details may be changed to protect the anonymity of the person.
- The advice given should not be taken as financial advice. You should consult widely and ask knowledgeable experts, not just random anonymous internet blog people. Think of this as a source of ideas to run by your 'real world' experts.
- Married couple both aged 28
- Reside in Vancouver and intend to remain in Vancouver
- Expect to begin having children in the next 4-6 years
- Combined gross employment income (earned roughly 50/50 by each spouse) is roughly $220K - $250K
- Currently renting at $1,050 / month + modest utilities. The rental is a nice 2 bedroom and they could live there for the next 3 years happily
- Have savings of $450-$500K
- Would like to stop renting in the next 3 years and buy a SFH in Vancouver.
- The reason for wanting to buy are that:
- Ultimately they would like to own their home (call this consumption, whatever...).
- Basically sick of living in a place that they can't make improvements to.
Well, what do you think? Is 'timing the market' the right way to go?
BTW, I'm pretty much through my backlog of 'ask VHB' questions. If you want to be featured next week, send an email with your situation.
[comments closed]
posted by Van Housing Blogger at 6:42 AM 95 comments
Housing starts down
The CMHC preliminary housing start data is out. (Full pdf here.) We get the finalreport with completions, starts, in-construction etc. at the end of the month.
Starts for Urban BC are down. The series, however, is very volatile, so we shouldn't make too much out of one month's number. Especially the 'seasonally adjusted at annual rates' number that gets quoted in the press. It whipsaws back and forth every month. I prefer working with the raw number and doing y-o-y comparisons to deal with the regular monthly variation.
Here is a chart for Vancouver CMA.
You can see a huge drop in August vs. July; and August 06 vs previous Augusts. However, if you take the July and August added together, we're still ahead of last year. The year-to-date number is up 13%. Also, in the pdf you can see that SFH starts are up compared to August last year - it is the multiple starts that are down. Because multiple starts are more lumpy, we expect that series to be more volatile.
All that said, down is down. We'll see next month if this was a trend or a blip.
posted by Van Housing Blogger at 6:39 AM 31 comments
Sunday, September 10, 2006
How's that Australian soft landing going?
 Answer: not too well. Record foreclosures. Prices down in some places by 25%.
In 2002 there were 2189 repossessions after defaults by borrowers. In the 12 months to March the figure was 4873 - more than double the rate under Paul Keating's 17 per cent interest rate regime in 1990.
Sydney real-estate agents have reported a sharp increase in repossession sales after home loan interest rate rises in May and August. Since 2002 there have been seven official interest rate rises.
"It's very, very sad," said PRD Nationwide Liverpool's Ray Dimarco, who has a number of default sales on his books.
"We've had some cases where they've handed the keys over and they're still wiping the kitchen down. They're still proud of their home."
Mr Dimarco said the market had slumped by up to 25 per cent in some pockets of Sydney, which had added to the panic in the market. People who had borrowed heavily to buy a $400,000 property just a few years ago wouldn't sell it now for much more than $300,000.
And remember, they had:Sydney real-estate agents have reported a sharp increase in repossession sales after home loan interest rate rises in May and August. Since 2002 there have been seven official interest rate rises.
"It's very, very sad," said PRD Nationwide Liverpool's Ray Dimarco, who has a number of default sales on his books.
"We've had some cases where they've handed the keys over and they're still wiping the kitchen down. They're still proud of their home."
Mr Dimarco said the market had slumped by up to 25 per cent in some pockets of Sydney, which had added to the panic in the market. People who had borrowed heavily to buy a $400,000 property just a few years ago wouldn't sell it now for much more than $300,000.
- The Olympics - the summer ones, not the teeny winter ones.
- The benefits of the commodity boom.
posted by Van Housing Blogger at 2:05 PM 51 comments
Friday, September 08, 2006
Krugman says 'bubblicious'
One of David's (from bubblemeter) favourite words is bubblicious. Watch Paul Krugman on this video say 'bubblicious' and a whole lot more. Hat tip to calculatedrisk.
Unrelated - check out this picture (from housingpanic). Marinite dates the picture from 1875. No really - it's different this time - we're Vancouver!

[comments closed]
posted by Van Housing Blogger at 10:28 AM 54 comments
How important are construction jobs?
Today the Sun has a big story about a special effects company locating in Vancouver. Yesterday we learned about the shoe empire in Burnaby. Are these the things driving BC's boom?
In a word: no.
It's construction.
Time to update our labour market industry breakdown. The charts below include data up to July, 2006. We did this once before, 8 months ago. Let's see if things have changed.
Employment in BC taking out construction and real estate/leasing jobs is up only 14% from January 2001 to now. The total population of BC age 15+ is up 8.7% over that same period, and the labour force is up 15.0%. So, the growth in non-construction jobs hasn't even kept up with the growth in the labour force.
On the other hand, construction employment has more than doubled and real estate/leasing employment is up about 20%.
How important are these to the overall unemployment rate? Answer: Very important.
Let's calculate the proportion of people age 15+ who are employed in construction. In January 2001, it was 3.0%. Let's say that, as a proportion of population, we keep this constant as we go forward to July 2006. This is effectively assuming that we don't need any more construction workers per BCer than we needed in January 2001. What happens now to the unemployment rate?
In this chart, I performed the above exercise assuming both construction and real estate/leasing employment to population ratios stay constant at their January 2001 levels. The purple line graphs out the actual unemployment rate. (Attentive readers might note a difference between the overall unemployment rate here and in the other unemployment chart. The difference, I think, is that the by-industry breakdowns are not seasonally adjusted. Not a big difference, though.)
The green line shows the rate under the constant real estate/construction employment assumption.
If there had been no construction boom, the green line shows us that the labour market boom would have pretty much been non-existent. The average gap between the purple line and the green line for the 12 months ended July 2006 is 3.1%. In other words, if construction employment as a share of population were to revert to its 2001 level, the unemployment rate in BC would jump by 3.1%, leaving 100K more people unemployed.
[clarifying update: the assumption I make in the above analysis is that the people not employed in construction remain in the labour force; seeking work. The alternative graph would have been to look at employment rates, which are calculated as a percent of population rather than the labour force. If you download the spreadsheet (see below) you can see the employment rates show a similar picture to the UE graph above.]
What's the point of this? I mean, construction is a part of the economy, so what do we learn by taking it out? Who cares so long as people are employed?
The reason this is informative is that it shows the sensitivity of our boom to construction employment. For the labour market, the boom is entirely about construction.
So, if something were to hit construction - a housing market downturn, for example - the great BC employment boom would be over. Those who argue that housing cannot go bust because employment is strong have the causality reversed - employment is strong because of the housing boom.
A final note. Some readers have pointed out the super huge number of infrastructure projects that are scheduled to be constructed over the next few years - 100 billion by some counts. The BC government produces a 'major projects inventory' publication (big pdf here - thanks to 'scoop' for the scoop). On page 19, they have a table for the lower mainland:
For 2001, non-residential $value of construction permits was $1.384 billion. Residential was $2.013 billion.
For 2005, non-residential is $1.975 and residential is $4.41 billion.
So, if residential were to, say, fall by half, then non-residential would have to double again from 2005's already high number to make up the difference. So, all of those Olympic projects, bridges, and skytrains are nice mitigating factors, but they don't have enough firepower to fully compensate for any sizeable residential slowdown.
The spreadsheet with the raw numbers is available here.
posted by Van Housing Blogger at 9:04 AM 58 comments
Labour market steady at the top
The lastest jobs data release is out. BC's unemployment rate ticked up a tiny bit and the employment rate ticked down. No big moves. Given that the source for this data is a survey, there is going to be some noise in the month-to-month numbers. So, it wouldn't be useful to over-interpret little ticks up or down.
That said, looking over the last 6 months it looks like we may be past the recent peak of labour market frenzy. But compared to the long-term trends, the labour market is still in phenomenal, unprecedentedly good shape.
posted by Van Housing Blogger at 8:32 AM 3 comments