看来不少人对房地产收益率低的说法不满意,俺觉得好像也不该这么低,
看到文章里说,房地产的回报率是按照 shiller U.s home price index 算的,
美国当年房地产跌的很惨,这么看,我觉得数据是对的,
而加拿大房地产没那么那么跌过。。。
(Note that real estate returns here are measured by changes in the
Shiller U.S. home price index; they are not real estate stock [REITs] returns.)
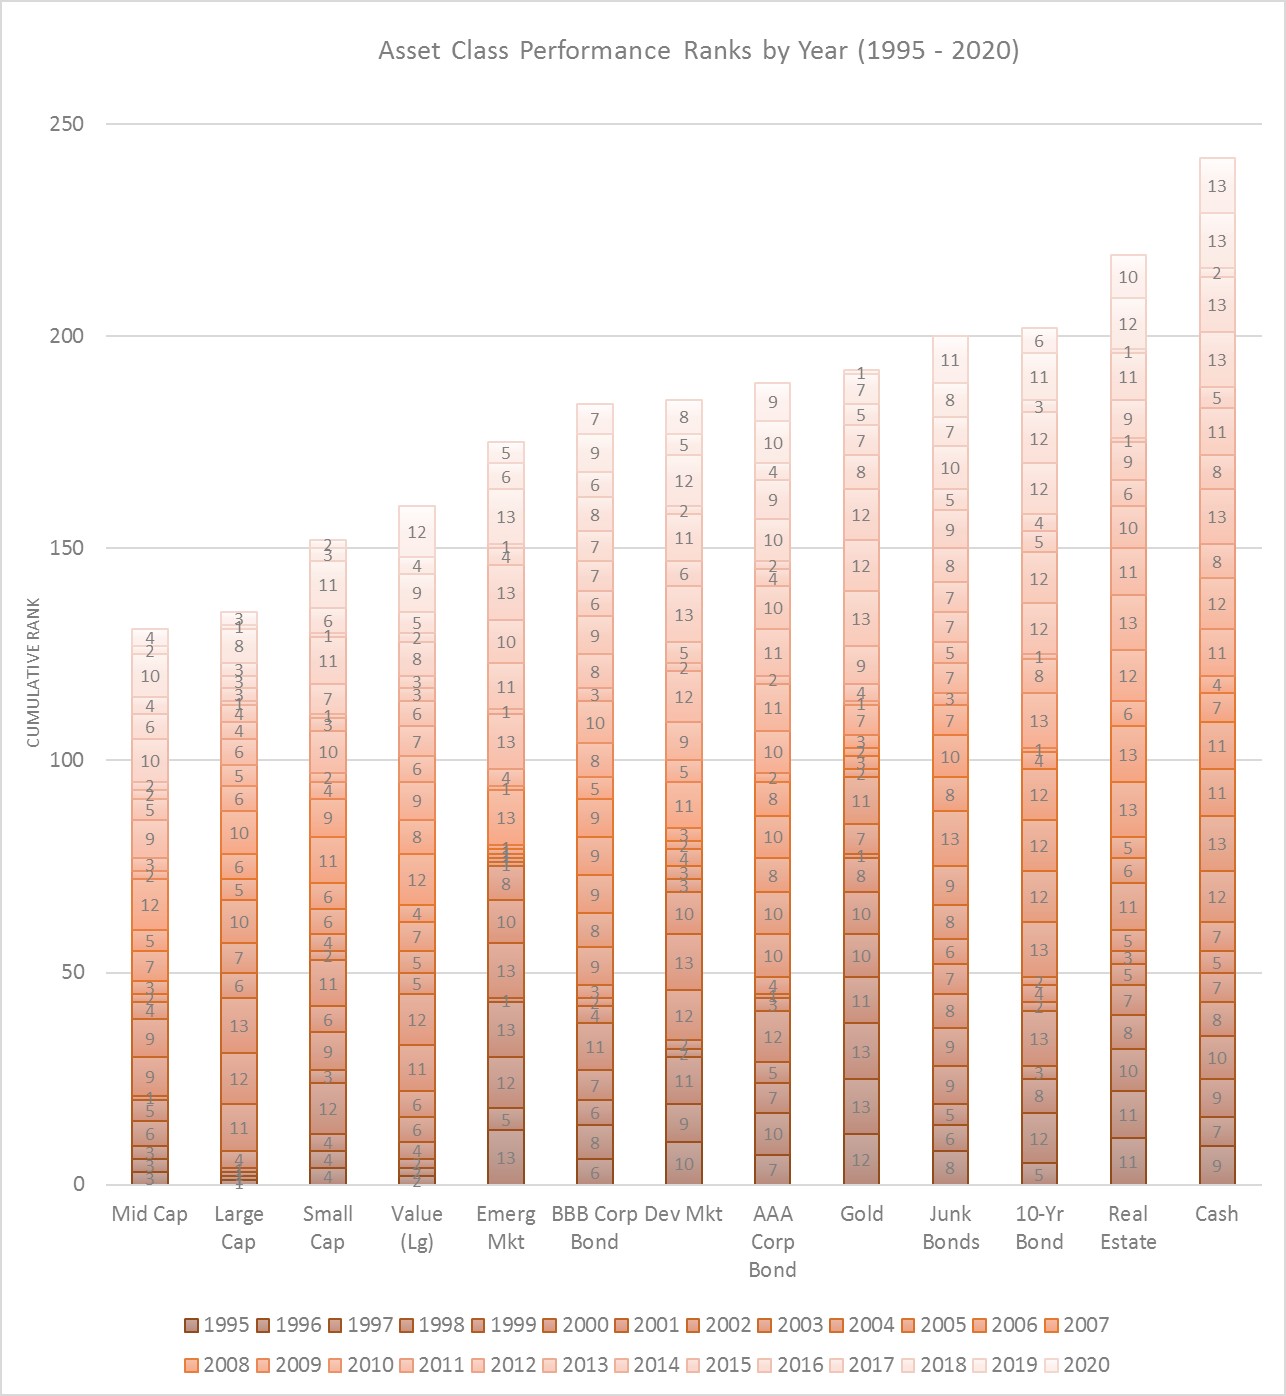
In this type of graph, shorter bars indicate better returns because, in any given year, the top-ranked asset gets a value of 1 and the bottom-ranked asset gets a value of 13. Higher ranks are shown by proportionally thinner blocks within each bar, and lower ranks are shown by proportionally thicker blocks.
The graph shows that U.S. mid-cap stocks had the best (lowest) cumulative rank, which is the sum of ranks across all 26 years. Cumulative rank gives us a way to see how various assets ranked over the entire period, rather than focusing on one year at a time. After U.S. mid-cap stocks, U.S. large-cap, small-cap, and large-cap value stocks had the best ranking history. And cash and real estate had the worst ranking history. (
Note that real estate returns here are measured by changes in the Shiller U.S. home price index; they are not real estate stock [REITs] returns.)
The annual building blocks in each bar of the above graph provide some sense of how ranks have varied over time for each asset. We can further quantify that variability with this graph showing the average (blue bars) and standard deviation (green error bars) of the annual ranks for each asset.
Shiller U.S. home price index
Case-Shiller house price index 2020. Includes inflation-adjusted prices for New York, Los Angeles, Chicago, Miami, Boston, Phoenix, San Francisco & 13 more.

realestatedecoded.com