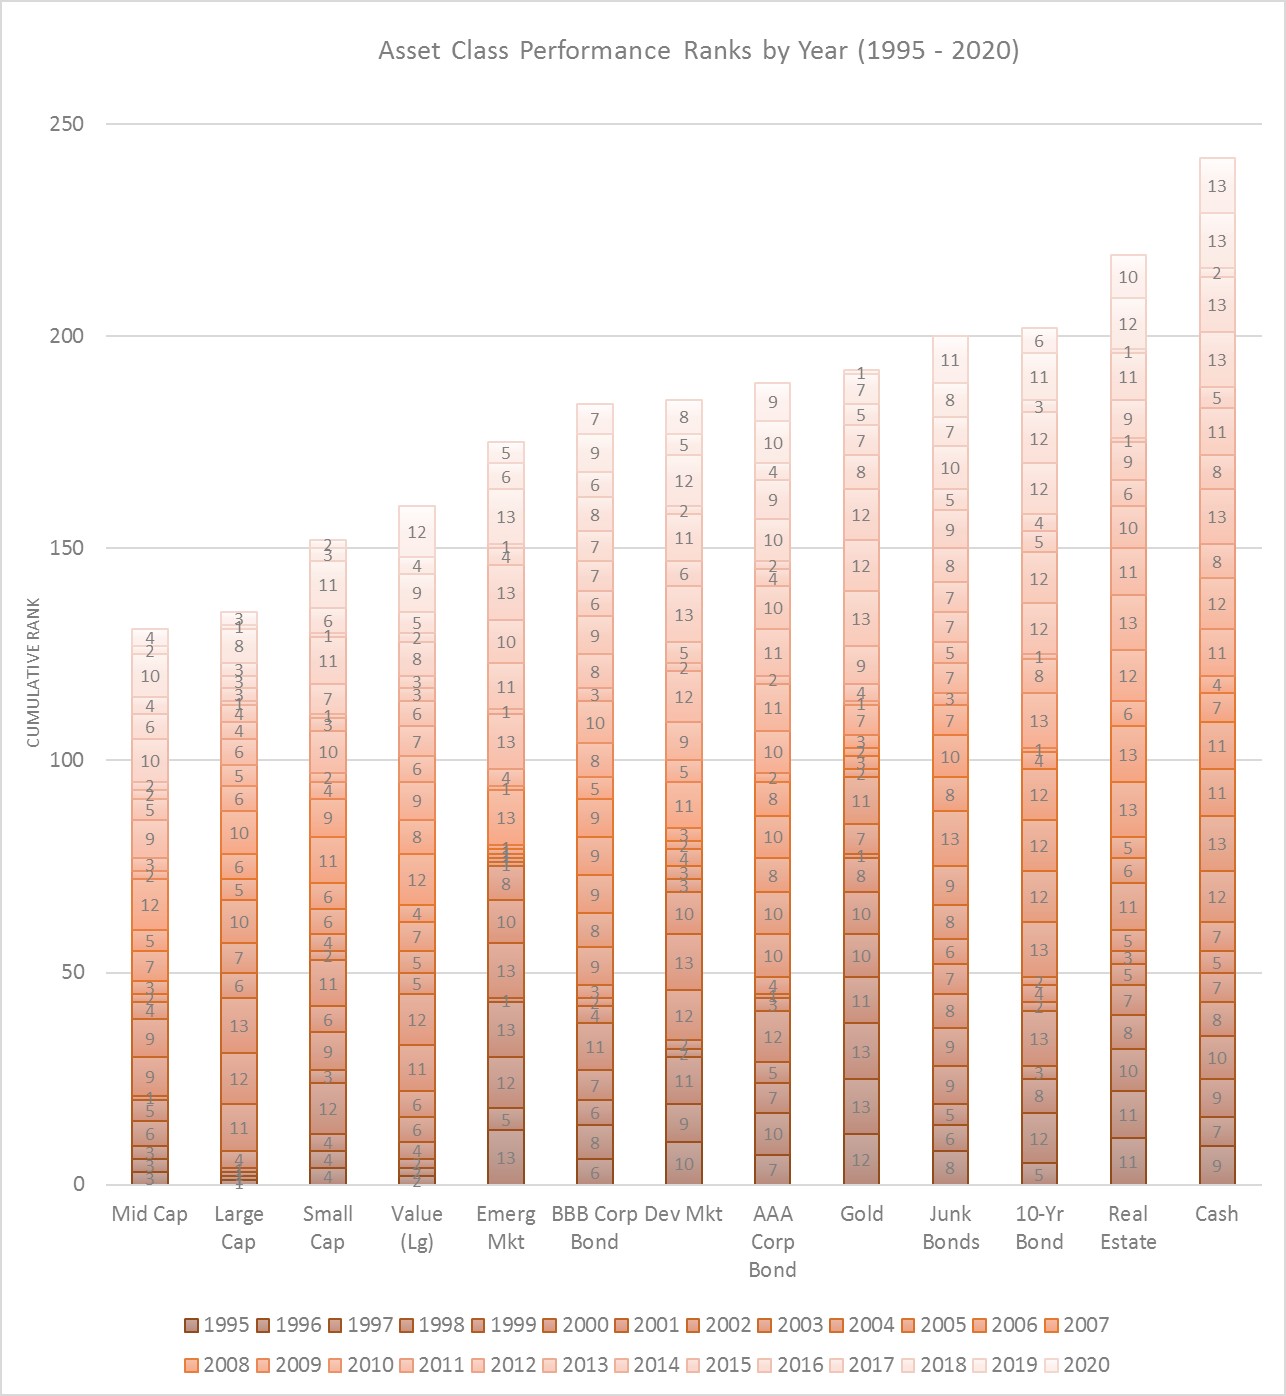
历史显示长期投资最佳组合: 美国10年期国债 + 金子 + 美国小盘股 + 新兴市场股票
美国国债+金子是一类,美国小盘股与新兴市场股票是一类,稳健加激进。
现金与房地产都不是好投资。。
Conclusions
If you’re looking to maximize long-term diversification, the results over both periods suggest that partial allocations to emerging market stocks, U.S. intermediate-term bonds, gold, and U.S. small-cap stocks are the best bets, if history is any guide for the future. And because today’s post focused on rank statistics, we shouldn’t forget that the diversification benefits from these four assets may turn out to be mostly emotional benefits.
You may “feel better” about your portfolio by adding some of these four assets, particularly at times when they react positively (or less severely in a negative direction) to market gyrations as compared to other assets in your portfolio. However, the ranking statistics also show that some of these assets (gold and 10-year bond in particular) spend a lot of time in the bottom half of the ranks, which will be frustrating, particularly when it happens for many years.
The long-term returns (and ranks to some extent) also confirm that, if we set emotions aside, the most rational portfolio for long-term investors is almost any mixture of primarily U.S. stocks. And because mindful investors favor investing on rational, rather than emotional terms, rank statistics don’t support the idea of placing substantial bets on bonds or gold.
")