历史数据分析,长期投资最佳组合

阿吾

踏实做事 有趣做人
最大赞力
0.06
当前赞力
100.00%
看来不少人对房地产收益率低的说法不满意,俺觉得好像也不该这么低,
看到文章里说,房地产的回报率是按照 shiller U.s home price index 算的,
美国当年房地产跌的很惨,这么看,我觉得数据是对的,
而加拿大房地产没那么那么跌过。。。

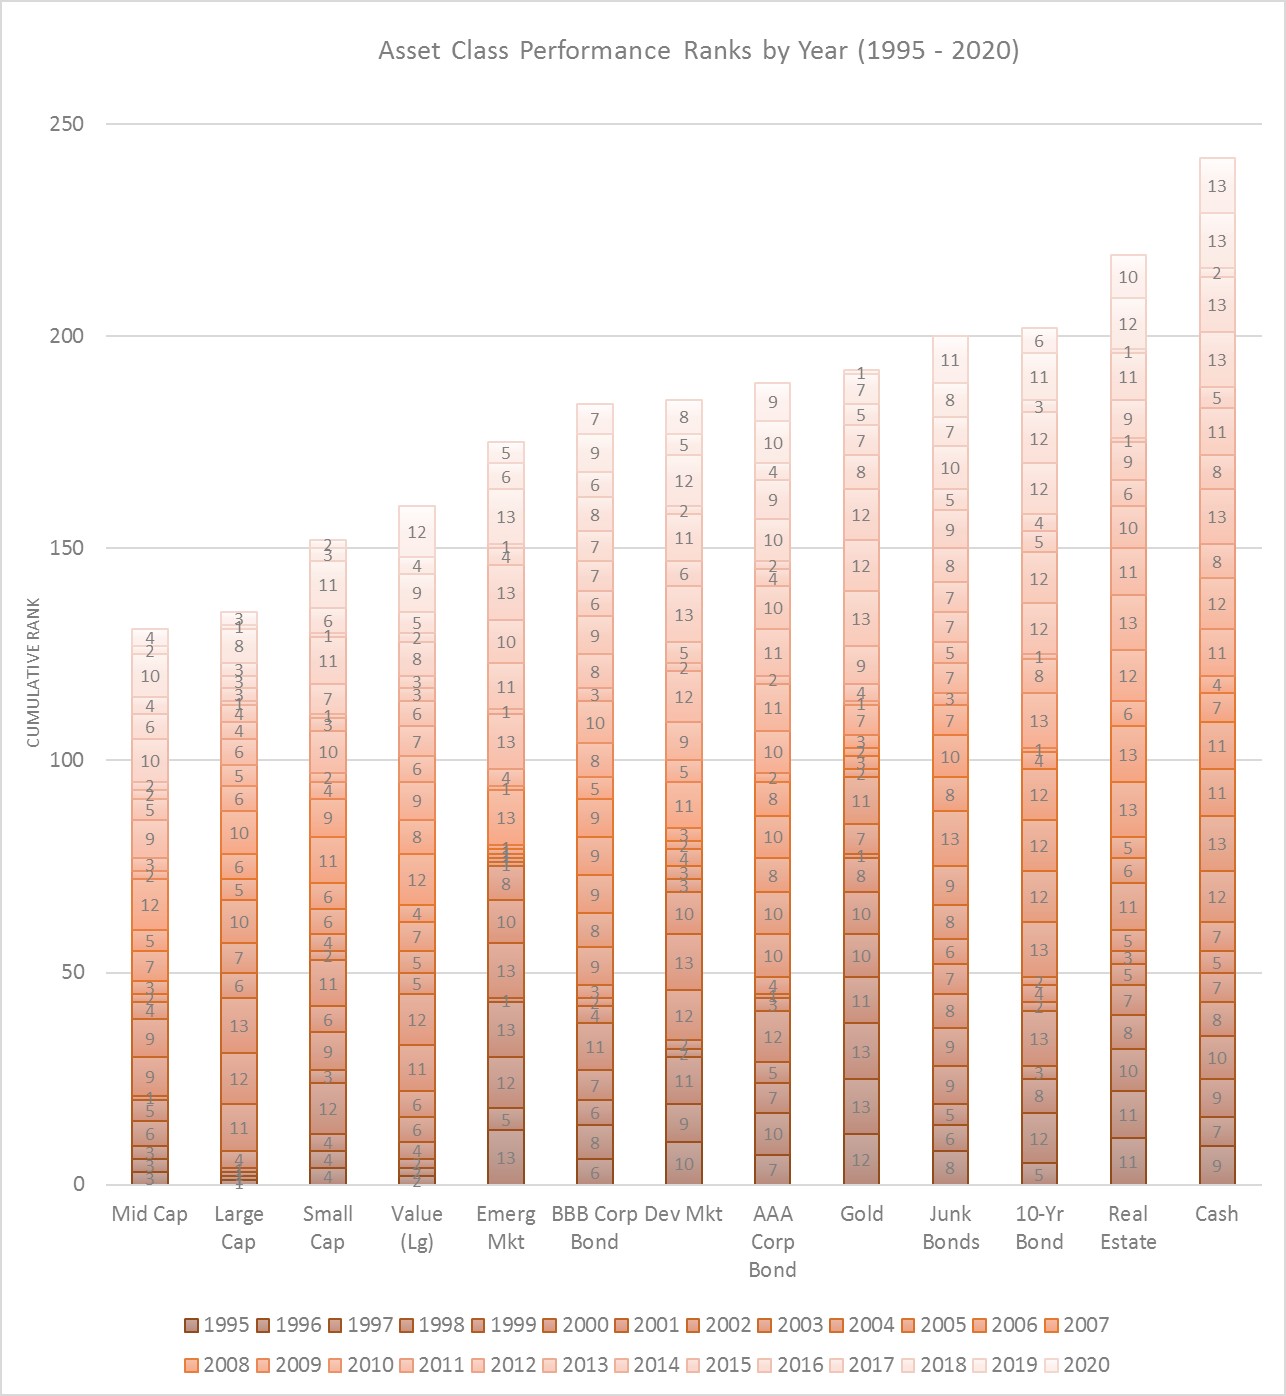
(Note that real estate returns here are measured by changes in the Shiller U.S. home price index; they are not real estate stock [REITs] returns.)


In this type of graph, shorter bars indicate better returns because, in any given year, the top-ranked asset gets a value of 1 and the bottom-ranked asset gets a value of 13. Higher ranks are shown by proportionally thinner blocks within each bar, and lower ranks are shown by proportionally thicker blocks.

The graph shows that U.S. mid-cap stocks had the best (lowest) cumulative rank, which is the sum of ranks across all 26 years. Cumulative rank gives us a way to see how various assets ranked over the entire period, rather than focusing on one year at a time. After U.S. mid-cap stocks, U.S. large-cap, small-cap, and large-cap value stocks had the best ranking history. And cash and real estate had the worst ranking history. (Note that real estate returns here are measured by changes in the Shiller U.S. home price index; they are not real estate stock [REITs] returns.)

The annual building blocks in each bar of the above graph provide some sense of how ranks have varied over time for each asset. We can further quantify that variability with this graph showing the average (blue bars) and standard deviation (green error bars) of the annual ranks for each asset.


Shiller U.S. home price index

 
最大赞力
0.00
当前赞力
100.00%
贵金属上下波动很厉害的,我买贵金属基金十几年,日涨跌5%根本不稀奇。作为基金日涨跌算较大的,怎么会属于稳健投资呢。
债券的话,大多数人虽然没有直接买,但是银行卖的稳健类平衡类基金多少都会含一定的比例。
 
最后编辑: 2021-03-18

Similar threads

家园推荐黄页

家园币系统数据

家园币池子报价
家园币最新成交价
家园币总发行量
加元现金总量
家园币总成交量
家园币总成交价值

池子家园币总量
池子加元现金总量
池子币总量
1池子币现价
池子家园币总手续费
池子加元总手续费
入池家园币年化收益率
入池加元年化收益率

微比特币最新报价
毫以太币最新报价
微比特币总量
毫以太币总量
家园币储备总净值
家园币比特币储备
家园币以太币储备
比特币的加元报价
以太币的加元报价
USDT的加元报价

交易币种/月度交易量
家园币
加元交易对(比特币等)
USDT交易对(比特币等)
顶部